Hey folks,
My first coding project over a decade ago was scraping Instagram (“which was the fashion at the time”) for street art tagged photos with locations, and putting them on a map. It was a fun way for me to demo my new skills, touch in with my mapping background and also find where to look for street art in new cities.
The original project is long gone but I have always kept a copy of the data and finally got around to bolting it on to my blog, and, most importantly, using it to show off the h3 grid system.
Some screenshots:
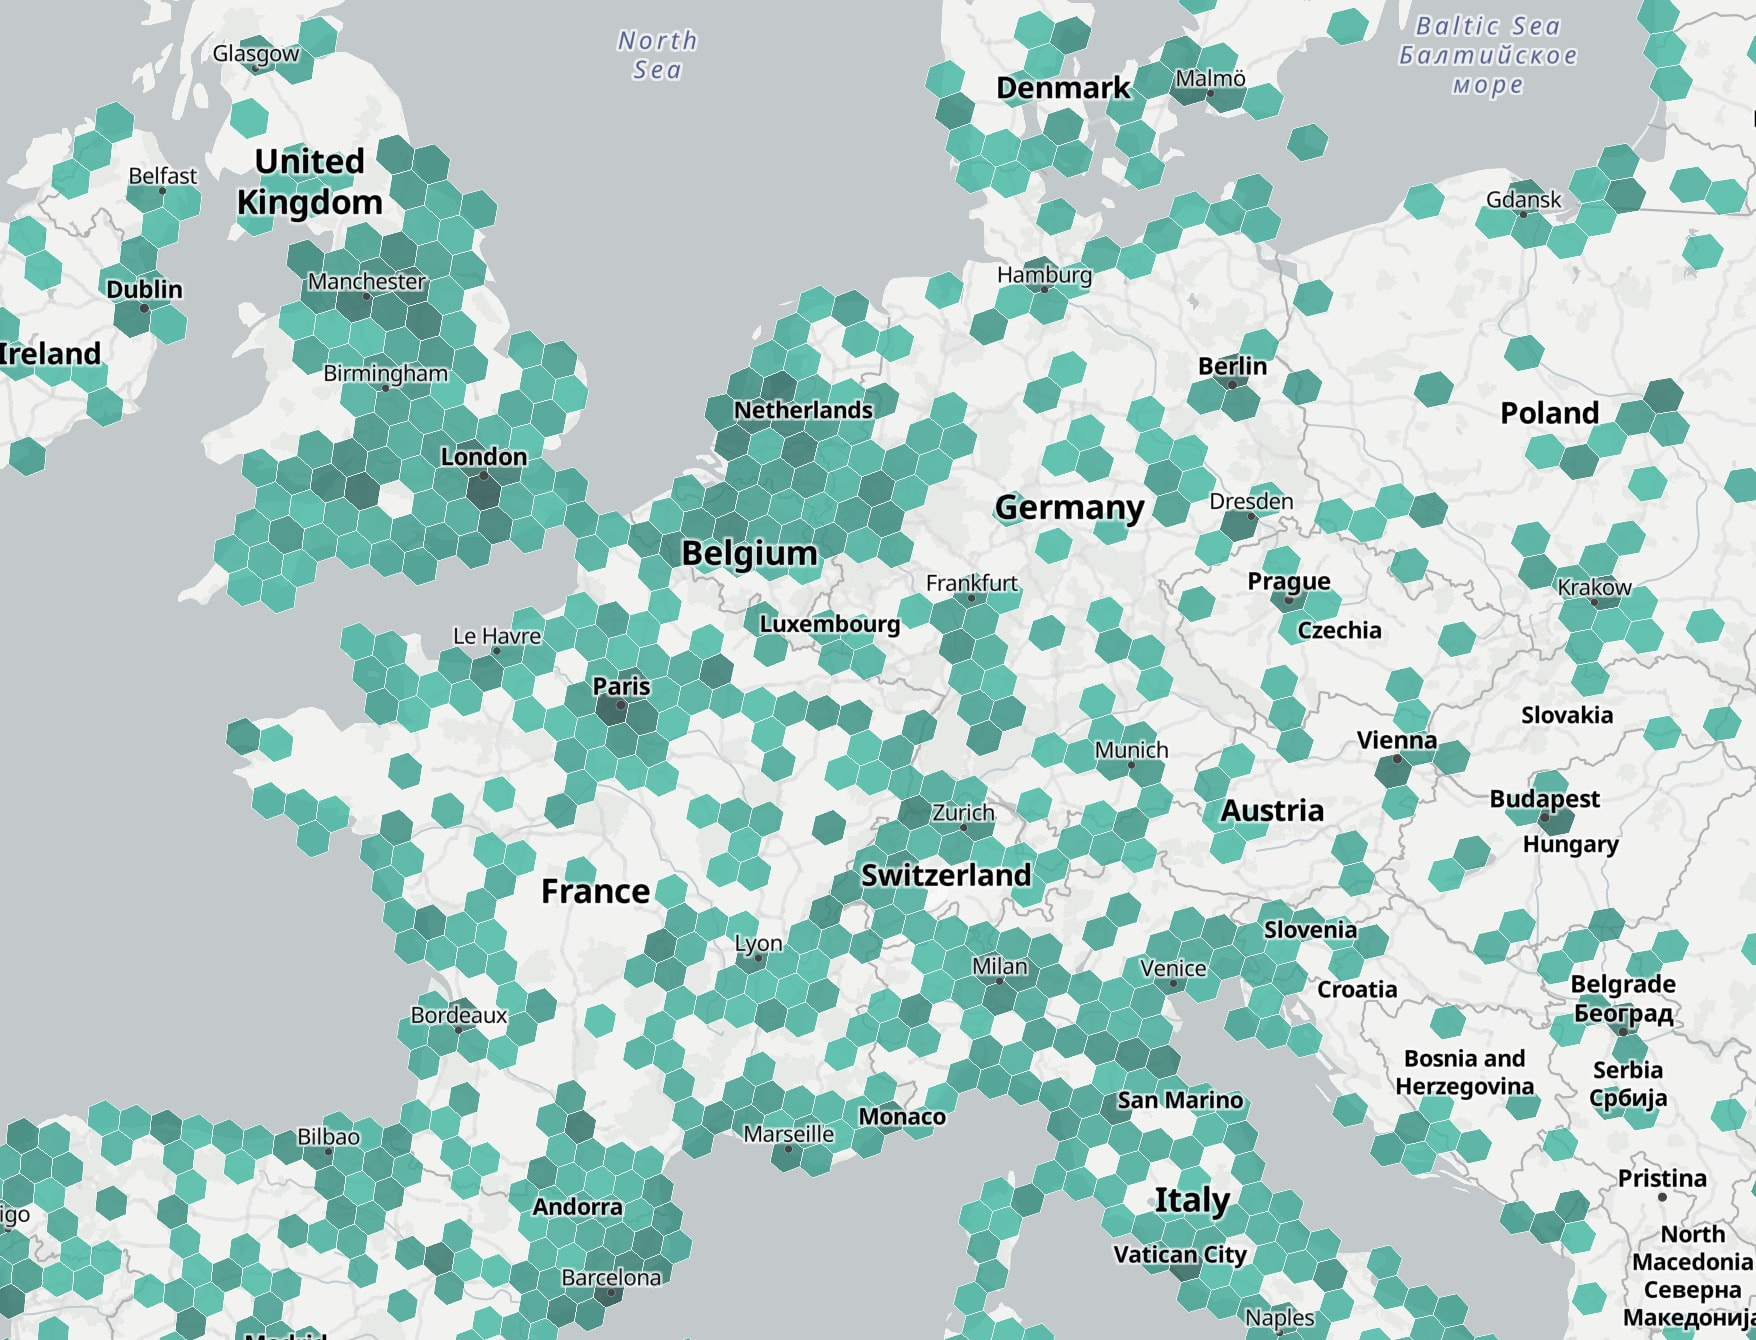
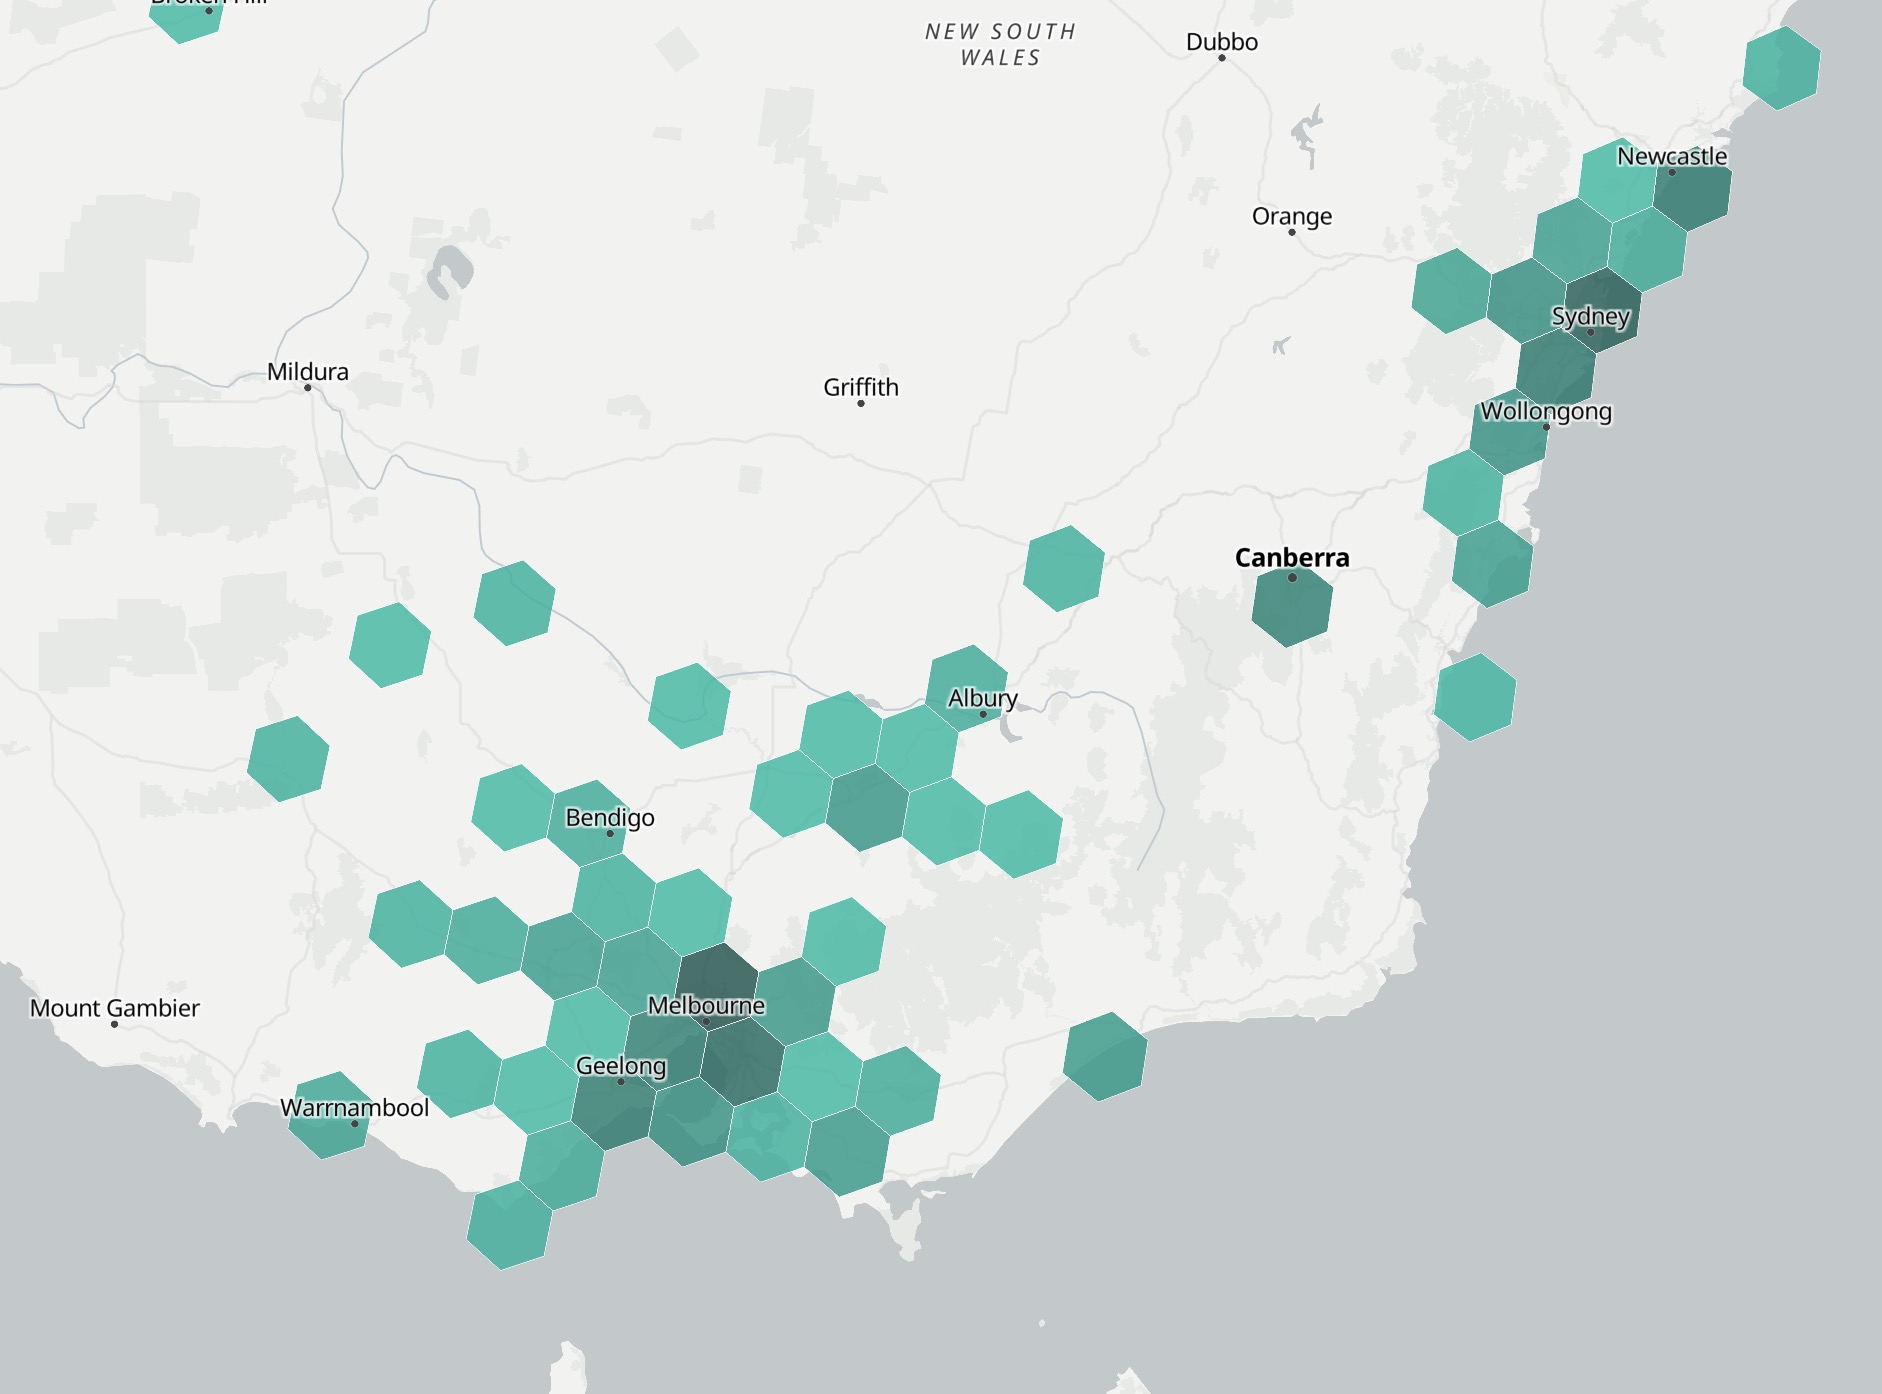
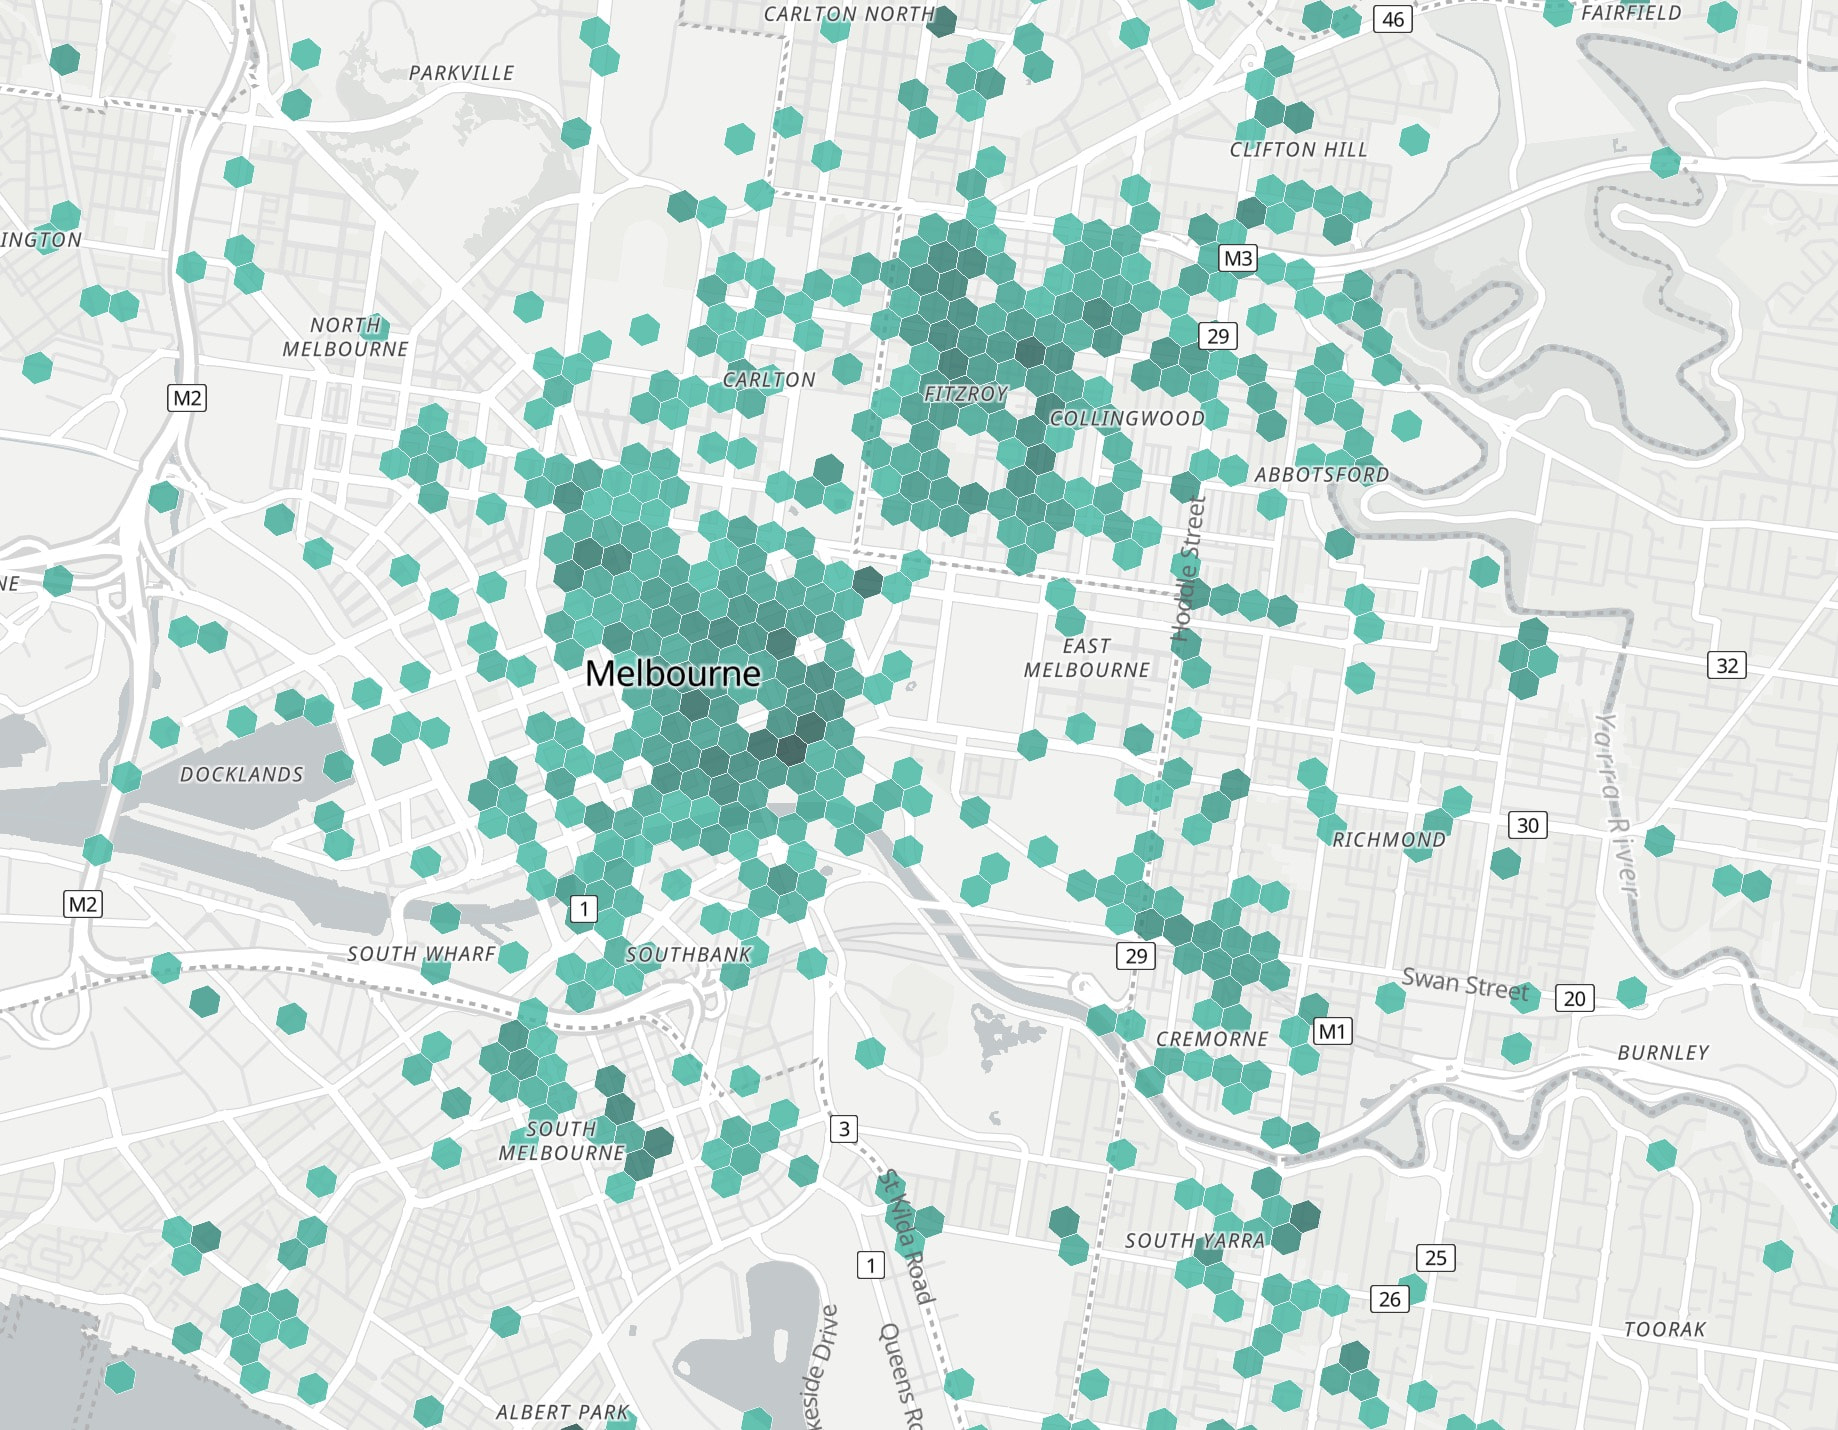
So, what does this mean for SAC?
Well, for one thing, I would recommend that a h3 index of the SAC data is a better representation for the SAC map, when “zoomed out”.
Why? It is much more performant than the clustering used, so it would speed up load time (great when you are in a sketch area with sketchy cell reception!). When the user is “zoomed in”, then we can cut over to displaying the current rendering that uses cluster/point representations, which has a heavier payload because it has the full details of each record (which is what you want when you are zoomed in). Visually, the clustering algo splits the indication of “density” over two factors; clusters of uniform red and number. The h3 grid styling could channel that into just one factor, intensity of the colour ramp, providing a clearer visual signal of density.
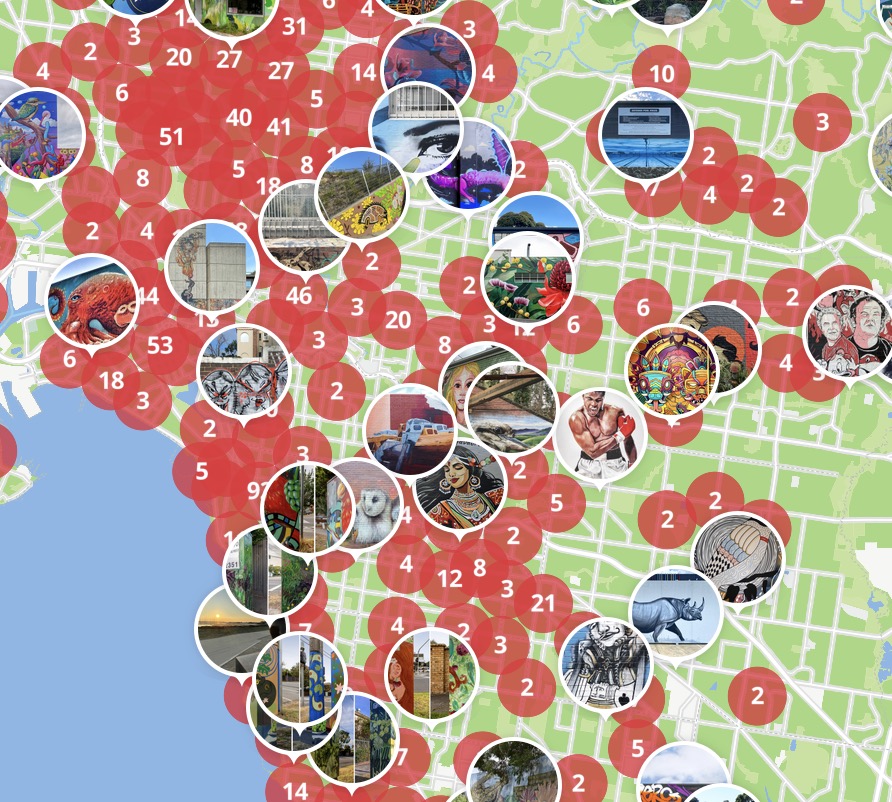
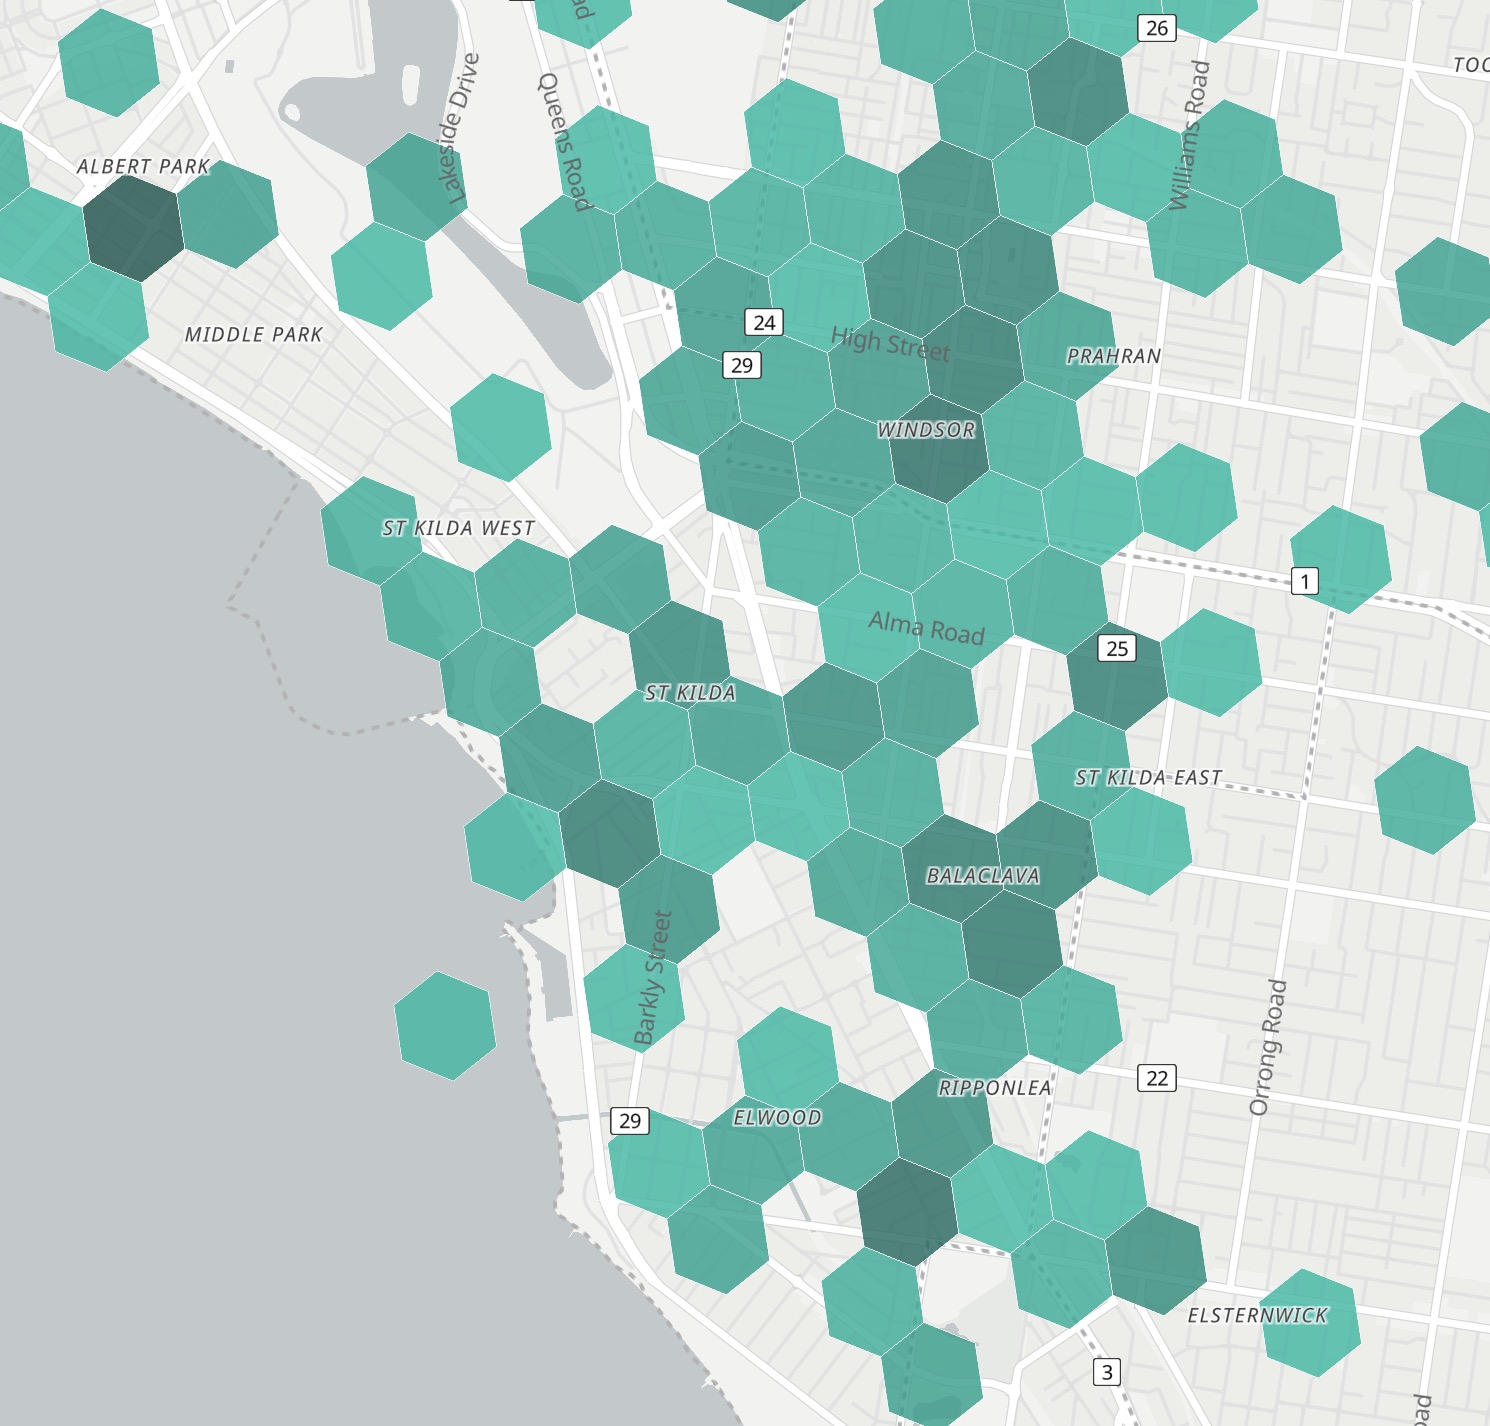
Given that the endpoint/map-layer for the current clustering representation already exists, it actually would not be that difficult to allow users to select their own cross-over point in the map-zoom levels, if they prefer one or the other at different zoom levels.
This could also lead to a new “mode” for using SAC; something like a “discovery mode”
I love that we have the full details of the pieces; it can be SOOO cool to read up on the history or background of a piece when we discover it.
And… Sometimes I just want to know what area to rummage around in without seeing any hints of what art there is to discover there, because I kinda want that feeling of seeing the art with my own eyes first, before getting the richness of the SAC records.
The h3 grid could be on at all zoom levels in discovery-mode; you can take a quick look and figure out a street or hood to scope out.
An extension to this discovery-mode could be extending the “seen” marker concept, on individual records, to “seen” at the block/hex-cell level; track what areas of a city that you have personally scouted and enjoyed. A color ramp could even indicate how recently you’ve visited, in case its time to head back to hosier lane again ;). You can get a sense of your exploration relationship to a particular city. All this is possible because the h3 address for grid hexes is quite light-weight.
More than happy to help out with the product/code aspects of this if there is any interest in bringing this to SAC 